eXplainable PRS (XPRS)
Overview
XPRS is a web-based platform that can be used to explain and visualize PRS results.
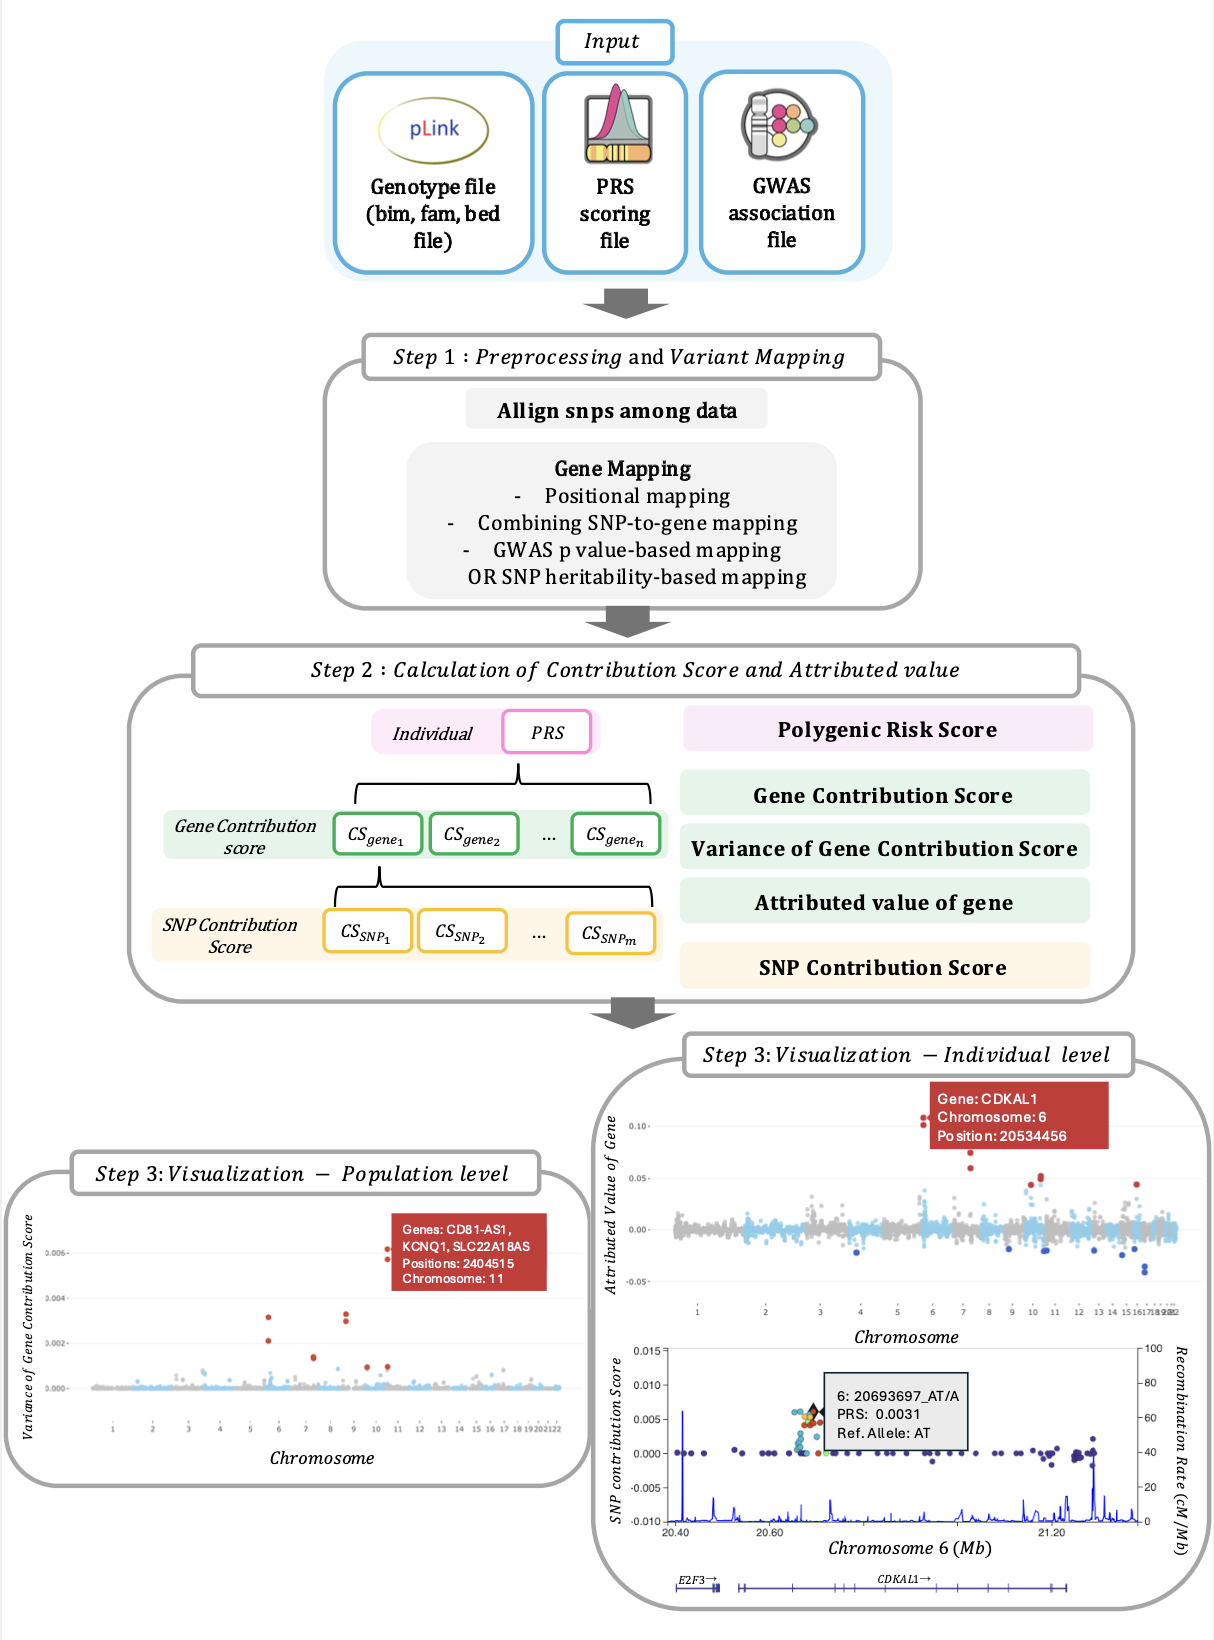
This figure illustrates the overview of XPRS. Input: Genotype file, PRS scoring file, and GWAS association file. Step 1: Preprocessing: Align SNPs and map them to genes using positional mapping, combined SNP-to-gene mapping, and GWAS p-value or SNP heritability-based mapping. Step 2: Calculation: Compute Polygenic Risk Score (PRS), Gene Contribution Score (CSgene), variance of Gene Contribution Score, Attributed Value of Gene (Agene), and SNP Contribution Score (CSSNP). Step 3: Visualization: Population Level: Manhattan plot highlights significant risk genes based on variance in gene contribution scores. Individual Level: Distribution plot, gene-based Manhattan plot, and LocusZoom-like plot show individual's PRS and specific genetic contributions.
Access the XPRS Web Service
You can explore XPRS via our cloud-based web service.
To view the preprocessed data, follow these steps:
- Navigate to the Run section and select Case 1-1.
- Enter the following paths in the respective fields:
- Cohort.genotype.file: ./data/sample
- RDS.file: ./output/sample.RDS
- Submit the form to view the results.
Running XPRS locally
To use XPRS, you must run it locally and specify the direct paths to your data files on your machine. You can see Github link to how to do so.