eXplainable PRS (XPRS)
< return to Run
Population level
Manhattan Plot
The Manhattan plot below shows the risk genes within the population. Red represents top 10 risk genes within the population.
Table
The table below lists the top 10 risk genes within the population.
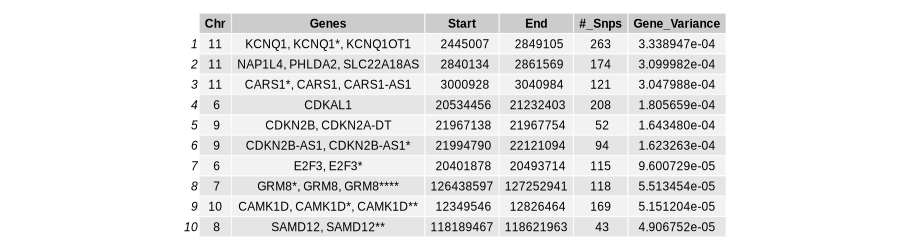
-
Chr: Chromosome number where the gene is located.
Genes: Names of the genes identified as risk genes.
Start: Starting position of the gene on the chromosome.
End: Ending position of the gene on the chromosome.
#_Snps: Number of SNPs (Single Nucleotide Polymorphisms) included in the analysis for the gene.
Gene_Variance: Variance of the Gene Contribution Score.